5. Trigonometric Functions and Graphs
5.1 Graphing Sine and Cosine Functions
Class Notes
The McGraw-Hill Ryerson PreCalculus 12 Text is used as the Main Resource.
Assignments in the Powerpoint Lesson Plans refer to pages and questions in the PreCalculus 12 text.
![]() 5.1 Graphing Sine and Cosine Functions
5.1 Graphing Sine and Cosine Functions
![]() 5.1 Formative Assessment Amplitude and Period
5.1 Formative Assessment Amplitude and Period
Digital Resources
Unwrapping the Circle: 5.1 Deroulecercle.ggb
![]() Unit Circle Graphing Sine and Cosine
Unit Circle Graphing Sine and Cosine
Pedagogical Shifts: TRANSFORM, Moving from Traditional to Student-Centered
Shifting from Student as Knowledge Recipient to Student as Inquirer and Creator
Shifting from Memorization to Higher-level Thinking
Desmos pre-created interactive graphs for trig functions are available online. Follow this link.
https://www.desmos.com/calculator Click on the bars in the upper left corner to view all pre-created interactive graphs.
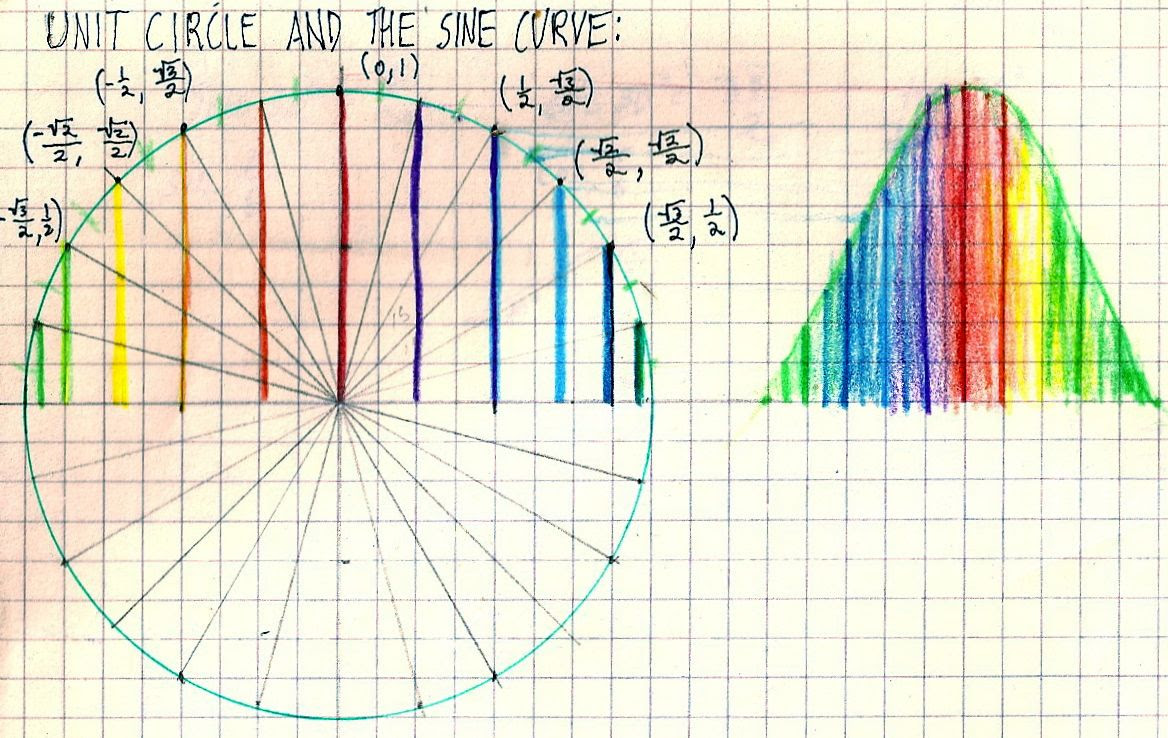
Building a Sine Curve and Making Connections to the Unit Circle.
This is a nice idea to make connections between the unit circle and the graph of the sine function. Students can trace the heights of the curve to build half a period of a sine curve. Possible follow up questions include "What would the other half of the graph look like?" Connections could also be made to characteristics of a sine function graph such as amplitude and period.
Template for Building the sine function graph.